
European Geologist Journal 54
Municipality of Cestica, North-western Croatia: Techno-economic analysis of investment in geothermal energy
by Ratko Vasiljević 1
1 ECOINA Ltd, S.R. Njemačke 10, 10020 Zagreb, Croatia
Contact: rvcro@yahoo.co.uk
Abstract
The Pannonian part of Croatia is rich in geothermal water sources, while there are few mineral and thermo-mineral springs. Considering the available data, the possibilities of using geothermal energy in the municipality of Cestica, NW Croatia are investigated. Its location and distance from existing geothermal sites gives a positive and realistic assumption for the existence of low-temperature (below 100 °C) reservoirs of geothermal water in the municipality. This paper presents a techno-economic analysis that includes savings in fossil fuels and a consequent decrease in greenhouse gas emissions in the atmosphere for a low-temperature geothermal site and parameters that can justify investment in further exploration and development, and also in its contribution to the energy transition.
Cite as: Vasiljevic, Ratko. (2022). Municipality of Cestica, North-western Croatia: Techno-economic analysis of investment in geothermal energy. European Geologist, 54. https://doi.org/10.5281/zenodo.7882871

This work is licensed under a Creative Commons Attribution 4.0 International License.
1. Introduction
The municipality of Cestica is in the northwestern, Pannonian part of Croatia. The area of the municipality is 46 km2, with a population of about 6,000 people. The active population is mainly engaged in viticulture, agriculture and farming as the main economic activities. The municipality also has ambitions to develop tourism. The purpose of the feasibility study of geothermal energy use was an analysis of the profitability of the investment for further geological surveys and potential exploitation activities, in order to use geothermal water for the heating of households and greenhouses and for balneology.
The Pannonian part of Croatia is rich in geothermal water sources and the thermal waters of north-western Croatia are associated with certain tectonic and lithostratigraphic conditions. Considering the expected depths of potential geothermal water at approximately one thousand metres, according to the indicated gradients, the temperature of geothermal water in the reservoir would range from 50–60 °C, and expected usability for direct heating is 30 °C [1]. It is important to point that this location has low-temperature geothermal potential (<100 °C). This is usually not of interest to potential investors, but considering recent trends of prices of energetic resources and prices of CO2 emissions, mostly from combustion, low-temperature reservoirs have potential to gain the attention of investors and subsequently to participate in the energy transition.
The contribution of this paper is the demonstration of geology as a basis for defining the profitability of energy projects, and emphasising the importance of economic geology and its further development with regard to new requirements.
2. Materials and Methods
This paper presents techno-economic analyses as the basis of rational research and production of geothermal energy. The following components are discussed:
- Investments,
- Expenditures,
- Revenues.
Energetic projects are long-term projects, so this evaluation was done for a period of 20 years. The prices for each component depend on the market, which is volatile, so a rough estimation for each parameter was used for estimating whether such a project is feasible or not. If there is interest in further development, the techno-economic evaluation will be upgraded with more precise parameters. Starting from the initial settings, within the territory of the municipality of Cestica the expected values of geothermal gradient are 40 °C/km and in more favourable situations well over 50 °C/km. Within the expected depths of potential geothermal reservoirs at a depth of one thousand metres, according to the indicated gradients, the temperature of geothermal water in the reservoir would range from 50–60 °C, while the expected usability for direct heating is 30 °C. Estimated inflows for the predicted type and depth of the reservoir range from a thousand to a few thousand cubic metres per day. Preliminary investment was taken from the feasibility study [1], which is based on prices of drilling and surveying for the Croatian part of the Pannonian Basin.
Data from the commodity exchange were used for prices of natural gas [6] and CO2 [7]. Considering the volatility of commodity markets, averages of long-term prices trends were taken. For natural gas, the average price was taken for the time period 1998 – Jun 24 2022 (Table 3), and for CO2, the average price was taken for the time period 2008–24 June 2022 (Table 4). Considering that the prices were expressed in different currencies, the relationship between currencies at the time of writing the paper was taken into account.
3. Geology
The Republic of Croatia can be roughly divided in two different areas: the Pannonian Basin and the Dinarides. In the Dinarides the average geothermal gradient is 0.018 °C/m. In the Pannonian Basin, the average geothermal gradient is much higher: 0.049 °C/m [2]. Since the geothermal gradient in the Pannonian area is considerably higher than the European average (0.043 °C/m), in addition to already discovered geothermal fields, it is probable that new fields will be discovered. The Croatian part of the Pannonian Basin is divided into four depressions: the Drava Depression, Mura Depression, Sava Depression and Slavonija-Srijem Depression. Oil and gas reservoirs along with source rocks are placed in a Neogene complex, which is divided into formations. Each depression has its own division (Table 1). Dominating lithology members are sandstones and marls from Lower Pannonian to Upper Pontian, which overlay eroded rocks of a pre-Tertiary complex. The municipality of Cestica is located in the Croatian part of the Pannonian Basin in the Mura Depression (Figure 1). In the area of the municipality of Cestica, expected geothermal reservoirs are located in pre-Tertiary fractured rocks at easily accessible depths (at roughly 1000 to 1200 m below the surface). The drilling target is at depths of about 1000–1200 m and expected temperatures at these intervals range between 50 and 60 °C [1].
Table 1: Lithostratigraphic division of the Croatian part of the Pannonian Basin [3].
|
Sava Depression |
Drava Depression |
Mura Depression |
Slavonsko–Srijemska Depression | Stratigraphy unit |
|
Lonja Formation |
Lonja Formation |
Vuka Formation | Upper and Middle Pliocene and Quaternary | |
|
Široko Polje Formation |
Bilogora Formation |
Vera Formation | Upper Pontian | |
| Kloštar–Ivanić Formation | Lower Pontian | |||
| Kloštar– Ivanić Formation |
Lendava Formation |
Vinkovci Formation |
||
|
Ivanić–Grad Formation |
Ivanić–Grad Formation | Upper Pannonian | ||
|
Prkos Formation |
Križevci Formation |
Murska Sobota Formation |
Valpovo Formation |
Lower Pannonian |
|
Prečec Formation |
Mosti Formation |
Vukovar Formation |
Pre-Badenian, Badenian, Sarmatian | |
| Pre-tertiary rocks, Mesozoic carbonates, Paleozoic magmatite and metamorphic complex | ||||

Figure 1: Project area and significant geothermic aquifers in Croatia [4, 5].
4. Results of Techno-economic analysis
4.1. Investments
Estimated investments amount to approximately EUR 2.7 million (Table 2), and consist of:
- Investment in the construction of two wells (extraction and injection), each 1000–1200 m deep;
- Investments in necessary underground and surface equipment.
Table 2: Estimation of total planned investment [1].
| DESCRIPTION | EUR |
| Two Boreholes – drilling, materials | 2,000,000 |
| Additional geological and geophysical surveys (10% of drilling costs) | 200,000 |
| Equipment – submersible centrifugal pump, heat exchanger, signalling and automation, connecting pipelines | 300,000 |
| Other | 200,000 |
| TOTAL | 2,700,000 |
4.2. Expenditures
The production of geothermal water is burdened by costs and obligations estimated according to the amount of water produced and consist of:
– Electricity consumption,
– Maintenance of well equipment and systems for preparation of geothermal water for use,
– Compensation for the exploitation of geothermal water.
Expenditures are estimated to total approximately EUR 30,000.
4.3. Revenues
Table 3 presents the calculation of thermal power for the forecasted amount of geothermal water production of 1000 m3 per day, which is a realistic amount considering the expected parameters of the reservoir and with production from a deep centrifugal pump. Revenues are thus calculated for the production of 1000 m3 of geothermal water per day and for expected usability of geothermal water temperature of 30 °C.
Comparing the energy value of geothermal water and natural gas, it is prominent that 1 m3 of geothermal water at a temperature of 30 °C give an energy value equivalent to 3.3 Sm3 of natural gas [1]. In calculating total revenue, the average price of natural gas from 1998 to 24 June 2022 was taken (Table 3).
Table 3: Historical annual average prices of natural gas (USD/MMbtu). Data from Henry Hub Natural Gas Spot Price – Historical Annual Data [6].
| Year | Price USD per MMbtu |
Price EUR per MMbtu (1 USD = 0.95 EUR) |
| 1998 | 2.09 USD | 1.99 EUR |
| 1999 | 2.27 USD | 2.16 EUR |
| 2000 | 4.31 USD | 4.09 EUR |
| 2001 | 3.96 USD | 3.76 EUR |
| 2002 | 3.38 USD | 3.21 EUR |
| 2003 | 5.47 USD | 5.20 EUR |
| 2004 | 5.89 USD | 5.60 EUR |
| 2005 | 8.69 USD | 8.26 EUR |
| 2006 | 6.73 USD | 6.39 EUR |
| 2007 | 6.97 USD | 6.62 EUR |
| 2008 | 8.86 USD | 8.42 EUR |
| 2009 | 3.94 USD | 3.74 EUR |
| 2010 | 4.37 USD | 4.15 EUR |
| 2011 | 4.00 USD | 3.80 EUR |
| 2012 | 2.75 USD | 2.61 EUR |
| 2013 | 3.73 USD | 3.54 EUR |
| 2014 | 4.37 USD | 4.15 EUR |
| 2015 | 2.62 USD | 2.49 EUR |
| 2016 | 2.52 USD | 2.39 EUR |
| 2017 | 2.99 USD | 2.84 EUR |
| 2018 | 3.15 USD | 2.99 EUR |
| 2019 | 2.56 USD | 2.43 EUR |
| 2020 | 2.03 USD | 1.93 EUR |
| 2021 | 3.89 USD | 3.70 EUR |
| 2022 | 6.01 USD | 5.71 EUR[1] |
| AVERAGE: | 4.30 USD | 4.09 EUR |
Another important issue is the prevention of CO2 emissions and cost savings. In calculating total revenue, the average price of CO2 since 2008 to 2022 was taken (Table 4).
Table 4: Historical annual average prices of CO2 (EUR/tonne). Data from Carbon Emissions Futures Historical Data. [7]
| YEAR | EUR |
| 2008 | 21.40 EUR |
| 2009 | 13.15 EUR |
| 2010 | 16.31 EUR |
| 2011 | 19.02 EUR |
| 2012 | 7.61 EUR |
| 2013 | 4.49 EUR |
| 2014 | 5.97 EUR |
| 2015 | 7.68 EUR |
| 2016 | 5.35 EUR |
| 2017 | 6.22 EUR |
| 2018 | 17.51 EUR |
| 2019 | 26.08 EUR |
| 2020 | 25.45 EUR |
| 2021 | 54.01 EUR |
| 2022 | 83.44 EUR[2] |
| AVERAGE: | 20.91 EUR |
The price of 1 m3 of natural gas equivalent was taken. It is important to see whether the consumpation of geothermal energy, for which we need to conduct surveys with the ever-present mining risk, will be economically competitive against natural gas.
Table 5: Energy ratio between geothermal water and natural gas.
| ITEM | QUANTITY | UNIT | |
| Volume of geothermal water for a day | 1,000 | m3/day | |
| Volume of geothermal water for a year | 365,000 | m3/year | |
| Energy for a day at usability temperature of 30 °C | 30,000,000 | kcal/day | |
| 125,520,000 | KJ/day | ||
| Energyfor a year at usability temperature of 30 °C | 10,950000,000 | kcal/year | |
| 45814,800,000 | KJ/year | ||
| 45.81 | TJ/year | ||
| Equivalent energy of natural gas for a year in MMbtu | 43,424.05 | MMbtu/year | |
| Price of natural gas in euro (MMbtu) | 4.09 | EUR/MMbtu | |
| Price of natural gas in euro annual | 177,604.36 | EUR/year | |
| Emission factor tCO2 / TJ (Terajoule) | 56.10 | tCO2/TJ | |
| Total Emission tCO2 / in a year | 2,569.941 | tCO2/year | |
| Price per emission unit in euro | 20.91 | EUR/tCO2 | |
| Annual Emission Fee | 53,737.47 | EUR/ year | |
| Annual expense of Natural gas annual + Annual Emisson Fee | 231,341.83 | EUR/year | |
The annual energy value of 1000 m3 of thermal water in EUR from Table 5 represents the annual revenue parameter. The value of the annual revenue parameter was rounded down to EUR 231,000, which increases the level of security of the revenue calculation (Table 6).
According to the energy institute Hrvoje Požar [8], the average natural gas energy consumption for a five-year period (2015–2020) in Croatia was 97,776.67 TJ of natural gas per year, and the annual average value per capita was 0.024224 TJ of natural gas. For the 6000 inhabitants in the Cestica municipality this means 145.344 TJ annually.
Other fuels used primarily for heating are coal and biomass from wood. The average annual coal energy consumption for the same five-year period (2015–2020) was 23,838.33 TJ, and the annual average value per capita was 0.0059 TJ of coal; for the 6,000 inhabitants in the Cestica municipality this means 35.435 TJ annually. The average annual energy consumption from wood for the five-year period was 53,435 TJ, or 0.013 TJ of wood annually per capita; for the Cestica municipality this means 79.43 TJ annually.
The total consumption of energy for 6000 inhabitants is:
Etotal = Enatural gas + Ecoal + Ewood = 145.34 TJ + 35.44 TJ + 79.43 TJ = 260.21 TJ.
1000 m3 of thermal water can ensure 45.81 TJ, which is 31.52% of the energy consumption from natural gas or 17.61 % of the total energy consumption for heat (Enatural gas + Ecoal + Ewood).
Table 6: Preliminary estimation of total planned investment revenue for the production of 1000 m3/day of thermal water.
| Year | Revenues | Investment | Expenditure | Revenues cumulative | Investments+Expenditure cumulative | Net profit |
| EUR | EUR | EUR | EUR | EUR | EUR | |
| 1 | 231,000 | 2,700,000 | 30,000 | 231,000 | 2,730,000 | -2,499,000 |
| 2 | 231,000 | 0 | 30,000 | 462,000 | 2,760,000 | -2,298,000 |
| 3 | 231,000 | 0 | 30,000 | 693,000 | 2,790,000 | -2,097,000 |
| 4 | 231,000 | 0 | 30,000 | 924,000 | 2,820,000 | -1,896,000 |
| 5 | 231,000 | 0 | 30,000 | 1,155,000 | 2,850,000 | -1,695,000 |
| 6 | 231,000 | 0 | 30,000 | 1,386,000 | 2,880,000 | -1,494,000 |
| 7 | 231,000 | 0 | 30,000 | 1,617,000 | 2,910,000 | -1,293,000 |
| 8 | 231,000 | 0 | 30,000 | 1,848,000 | 2,940,000 | -1,092,000 |
| 9 | 231,000 | 0 | 30,000 | 2,079,000 | 2,970,000 | -891,000 |
| 10 | 231,000 | 0 | 30,000 | 2,310,000 | 3,000,000 | -690,000 |
| 11 | 231,000 | 0 | 30,000 | 2,541,000 | 3,030,000 | -489,000 |
| 12 | 231,000 | 0 | 30,000 | 2,772,000 | 3,060,000 | -288,000 |
| 13 | 231,000 | 0 | 30,000 | 3,003,000 | 3,090,000 | -87,000 |
| 14 | 231,000 | 0 | 30,000 | 3,234,000 | 3,120,000 | 114,000 |
| 15 | 231,000 | 0 | 30,000 | 3,465,000 | 3,150,000 | 315,000 |
| 16 | 231,000 | 0 | 30,000 | 3,696,000 | 3,180,000 | 516,000 |
| 17 | 231,000 | 0 | 30,000 | 3,927,000 | 3,210,000 | 717,000 |
| 18 | 231,000 | 0 | 30,000 | 4,158,000 | 3,240,000 | 918,000 |
| 19 | 231,000 | 0 | 30,000 | 4,389,000 | 3,270,000 | 1,119,000 |
| 20 | 231,000 | 0 | 30,000 | 4,620,000 | 3,300,000 | 1,320,000 |
| Total | 4,620,000 | 2,700,000 | 600,000 | |||
| Profit | 1,320,000 |
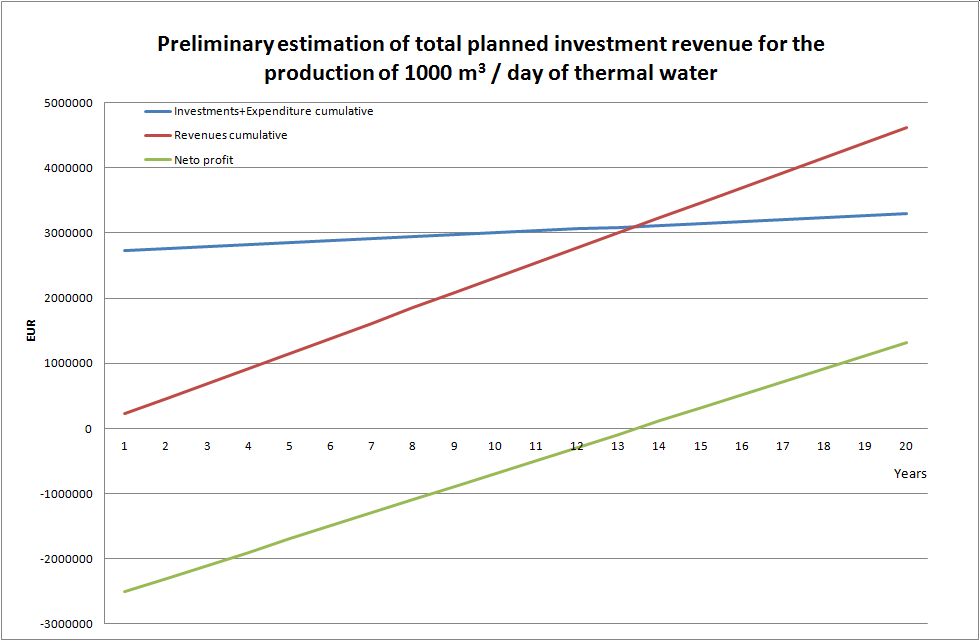
Figure 2: Preliminary estimation of total planned investment revenue for the production of 1000 m3/day of thermal water – graphic display.
According to the preliminary estimation of revenue, the daily production of 1000 m3 of thermal water will lead to a return on investment after thirteen years, with expected profit of EUR 1,320,000 after 20 years of operation.
Daily production of 1000 m3 of thermal water represents a relatively small amount, which still covers 31.52% of the energy consumption from natural gas or 17.61 % of the total energy consumption for heat. The pumping rate can be significantly increased without a significant increase in expenses, which can return the investment earlier.
This energy calculation and economic-financial assessment of profitability is burdened by mining risk, which will be minimised by further surveys and more detailed study. The big problem with geothermal energy is that it cannot be transported over long distances; it must be used in an environment close to the well.
The programme of economic use of geothermal energy will be designed according to the possible volume of production after the construction of the well. It is launched to achieve beneficial economic and social effects for the local and wider community through increasing tourist attractions with thermal baths and for use in greenhouse production.
These techno-economic indicators can attract potential investors because of geothermal energy’s reputation as a safe, environmentally friendly energy souce that is cheaper than other sources of energy. The fact is that after the return on investment, geothermal energy is certainly the cheapest energy source, burdened only with production costs.
5. Discussion
This paper presents a plan for use of geothermal energy as an internal heating source for households, greenhouses and for balneology, which can contribute to further development of tourism and recreation. Once experience is gained at the first site, it is possible to extend the user network and to raise interest in further investment in this area.
5.1. Contribution to the energy transition and a low-carbon economy
According to the preliminary estimation of daily production, 1000 m3 of thermal water provides 34,890 kWH (34.89 MWh) of thermal energy per day, or 12,734.85 MWh of produced thermal energy per year, which means savings of the equivalent energy of natural gas.
Rising energy prices and supply instability have led to serious increase in interest in developing geothermal resources and have triggered a completely new way of understanding country’s geothermal potential [9]. The average energy capacity of geothermal direct heat consumption in Croatia is 3–4 MWt and it is expected that there is another 1,500 to 2,000 MWt, which could generate as much heat as 600 million m3 of natural gas per year [9].
Each terajoule obtained by combustion of methane emits 54.9 tonnes of CO2, which means the emission factor of methane is 54.9 tCO2/TJ [10]. Expected daily produced thermal energy is 34.89 MWh, or 0.13 TJ, which means a decrease in greenhouse gas emissions by 7.14 tCO2/day, or 2,606 tCO2/year. These annual emissions of CO2 are relatively low; for example, installations for fuel combustion with low emissions can emit up to 25,000 tCO2/year [10], but further experience is expected to enable development of further capacities in the future.
5.2. Anticipation of additional surveys
In addition to establishing the framework of feasibility of the overall project, the techno-economic evaluation should be kept in mind at each step in the project, so a further step is deciding on the type and scope of the survey.
According to general geological situation in the surrounding area, it can be concluded that this area has a great deal of potential,ut this assessment needs direct confirmation. It can be directly confirmed by drilling an exploration well that can be used for production in the case of positive results. Drilling requires the activation of significant material and financial resources, so each exploration and production well carries geological and technological risk, which can jeopardize the whole project.
In order to decrease geological and technological risk, it is necessary to have an idea of the rational scope of investment in indirect geological and geophysical surveys for risk reduction. The risk cannot be completely eliminated, and for some risks there is no indirect survey methodology for defining them. In practice, the rational level of funds for a geological survey is one tenth of the value of the construction of the exploration and injection well (Table 2). Invested amounts in geological and geophysical surveys can cover a significant scope of geophysical surveying methods, such as geoelectric, magnetic and telluric methods, and with analysis of detailed geological, hydrogeological and geochemical indications.
These methods can be efficient in combination with existing data, but the final decision on the scope of surveys should be taken by the investor(s).
6. Conclusion
In this paper the expected properties of a low-temperature (<100 °C) geothermal water deposit were calculated. The original study was performed in 2011 for the Cestica municipality in the Pannonian section of Croatia. Considering the relatively low price of natural gas at that time, combined with the low price of greenhouse gas emissions and not completely established ETS, the feasibility of this project was positive, but with small revenue compared to the initial investment. The trend of increasing energy prices in combination with the established ETS system and rising CO2 emission prices have made projects of this type more attractive to investors in recent years.
It is clear that high-temperature geothermal deposits will always be more attractive to investors due to greater investment return possibilities, such as the possibilities of electricity production and of supplying a wider network of consumers, but the current trend of rising energy prices has increased the potential profitability of low-temperature geothermal reservoirs.
The advantage of low-temperature thermal reservoirs is their availability and wide distribution. The techno-econoic analysis reported here was done for a period of 20 years, which is a common practice for energetic facilities, in comparison with 20-year averages of gas prices and CO2 emission unit prices. Considering expected long-term trends (energy demands, spreading of the ETS), the prices will almost certainly remain high. A conservative approach was used, with a low pumping rate used in the calculation for the minimum value, and thus there is a prospect for significant increase if higher pumping rates are feasible. The complete return on investment is expected in the third quarter of the considered period, around year 13 or 14, and after that it is expected to bring a profit.
Despite the fact that this is only a preliminary assessment, it is evident that in the future projects of this type will be of interest to investors, especially from the aspect of energy transition requirements.
Funding: This research received no external funding.
Acknowledgments: I would like to express my gratitude to all of my colleagues from the former Panel of Experts on Oil and Gas for supporting my work, especially to Mr. Bogdan Lelyk (Ukraine) and Mr. Robert Lambert (UK), and to the company ECOINA Ltd. for its support.
Conflicts of Interest: The author declares no conflict of interest.
[1] Averaged data up to 24 June 2022
[2] Averaged data up to 24 June 2022.
References
- ECOINA Ltd (2012): Općina Cestica Studija mogućnosti korištenja geotermalne energije s programom istražnih radova u Općini Cestica – Municipality of Cestica, Study of the possibility of using geothermal energy, with the program of exploration works in the Municipality of Cestica, February, 2012
- EIHP (2017.): Energetic Institute Hrvoje Požar, National Energetic Programs, Use Of Geothermal Energy
- INA Naftaplin (1988): Prikazi iz karte naftnih i plinskih polja – Illustrations from the map of Oil and Gas fields
- GEOSLATINA d.o.o. 2010. Koncept izvodljivosti, strategija i ciljevi geotermalnih istraživanja na području Grada Slatine (Concept of Feasibility, Strategy and Goals of Geothermal Research in the City of Slatina), V.Nazora, Slatina.
- Vasiljević, R. (2019): Use of depleted hydrocarbon reservoirs for geothermal energy and its significance in energy transfer toward a low-carbon economy: a paper factory project in Slatina, Croatia, European Geologist 47 | May 2019, pp 15 – 20
- Henry Hub Natural Gas Spot Price – Historical Annual Data, URL: https://www.macrotrends.net/2478/natural-gas-prices-historical-chart (Consulted Jun 24 2022)
- Carbon Emissions Futures Historical Data, URL: https://www.investing.com/commodities/carbon-emissions-historical-data (Consulted: Jun 24 2022)
- EIHP (2021): Energy in Croatia, Annual Energy Report. Energetic Institute Hrvoje Požar.
- Kolbah, S., Živković, S., Golub, M., Škrlec, M. (2015): Croatia Country Update 2015 and On. Proceedings, World Geothermal Congress 2015 Melbourne, Australia, 19-25 April 2015
- Commission Implementing Regulation (EU) 2018/2066 of 19 December 2018 on the monitoring and reporting of greenhouse gas emissions pursuant to Directive 2003/87/EC of the European Parliament and of the Council and amending Commission Regulation (EU) No 601/2012
This article has been published in European Geologist Journal 54 – Geothermal energy – A geological contribution to the energy transition
Read here the full issue:
